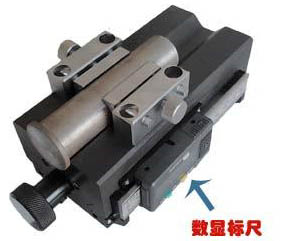
Technical Specifications
The AVP is easily installed in the L.O. and W.S. hard meters of various types;
(a) Repeated positioning accuracy: 0.01 mm;
Controls the movement: move handle/spectrum screen.
Measure position:
General penetrator steel
Step 1 2 3 4 5 6 7 8
End distance (mm) 1.5 3.0 5.0 7.0 9.0 11.0 13.0 15.0
Step 9 10 11 12 13 14 15
End distance (mm) 20.0 25.0 30.0 35.0 40.0 45.0 50.0
Low-pretium permeability steel
Step 1 2 3 4 5 6 7 8
End distance (mm) 1.0 2.0 3.0 4.0 5.0 6.0 7.0 8.0
Step 9 10 11 12 13 14 15 16
End distance (mm) 9.0 10.0 11.0 13.0 13.0 15.0 20.0 25.0 30.0
Other measurement points and their location are self-moveable.
II: Method of measuring thorium perforation (end-of-pipe thorium pyrotechnic)
At the time of the test, the standard specimen is heated to austrogenic temperature, 30 to 40min, and is then placed rapidly on the end of the curry tester at the end of the fire. After completion, the specimen is removed, and the hardness measure is performed as required by the national standard, and the end curve is derived.
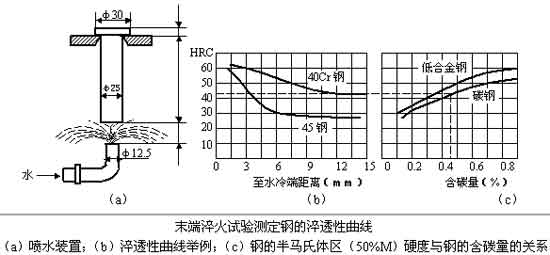
The permafrost properties of steel are determined by end-of-pipe pyrotechnics, as shown below:
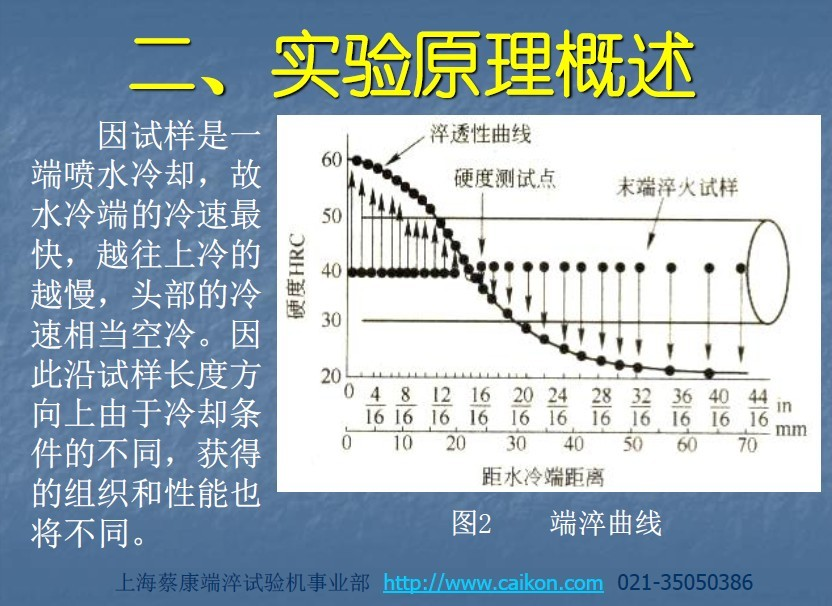
Here's the figure. A pyramid end-of-pipe pyramid test permolator curve
When cooling is complete, a hardness value is measured at each range of distance from each side of the sample, and changes in the hardness along the long direction are obtained, i.e., the cone-transformation curve of the steel, as shown in the figure below.
 Official hotline:021-61905265